
Here’s how to read this: 40 percent of taxpayers with incomes between 30K and 40K pay more than 12.9 percent of their income in income and payroll taxes; meanwhile, 25 percent of people with incomes over $1M pay less than 12.6 percent of their income in these taxes. This suggests that there are a lot of very-high-income guys paying a lower tax rate than their secretaries.There were a number of things that caught our collective eye on this chart:

The first was that 25% of households earning between $20-30k actually pay more than the 15% their tax bracket requires of them. The effective tax rate for most households is usually less than their bracket and this is the only group for which this appears not to be the case. By our estimate that's about 2.8 million households, all of them in the fourth quintile of income earners in the United State, that are "overpaying" on their federal taxes. These are working class, hourly wage-earners, probably on the young end of things.
This seems odd, though we can think of a few reasons why this is the case. More on this later.
There are a number of effective tax rates that are comparable or higher to the median millionaires' rate for incomes well below seven figures. Krugman actually sells his point short about the number of wealthy people paying lower rates then their underlings: it's not just the bottom 40% of millionaires, it's probably most of them.
Which led us to this curious observation: the median effective tax rate paid by millionaires is actually less than it is for earners making $500,000-999,999 ... and by almost an entire percentage point too. That got us thinking: is this just a bump in an otherwise upward progression or does it essentially mark the crest of a "hook"?
There are a few numbers to suggest that this is actually the case. First, there are the incomes over $10 million:
In 2009, the $10m+ club paid a median effective income tax rate of about 22.4%, and among them the whales of the economy paid even less:
The number of Americans reporting incomes of $10 million or more also plunged even more than the steep drop in income for the population as a whole.
Just 8,274 taxpayers reported income of $10 million or more in 2009, down 55 percent from 18,394 in 2007. Compared with 2007, total real income of these top earners in 2009 fell 58.6 percent to $240.1 billion, but average income slipped just 8.1 percent to $29 million.
Since 1992, the I.R.S. has compiled data from the returns of the 400 Americans reporting the largest income. In 1992, the top 400 had aggregate taxable income of $16.9 billion and paid federal taxes of 29.2 percent on that sum. In 2008, the aggregate income of the highest 400 had soared to $90.9 billion — a staggering $227.4 million on average — but the rate paid had fallen to 21.5 percent.In 2006 the average rate was 17%.
As luck would have it, Forbes just published it's annual list of the 400 wealthiest Americans this week, so these are the folks we're talking about here. Last on the list is the Washington Redskin's less-than-popular owner Daniel Snyder at $1.05 billion.
So it would seem that once you become a millionaire in America, your effective tax rate actually decreases on average. Naturally, it's a little more complicated than that. We broken down some tax data from 2009 and found that the threshold is just a little bit higher:
$1-2 million = 25.3%Here's what it all looks like in graph form:
$2-5 million = 25.7%
$5-10 million = 25.25%
$10+ million (- wealthiest 400) = 22.95%
Wealthiest 400 = 21.5%*

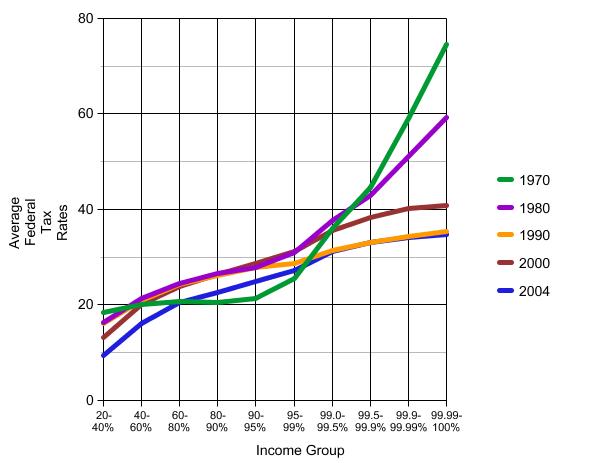
All too often folks defend the wealthy against charges of not paying their fair share by clumping them together in a group, as if they earned their wealth together as some kind of collective. The fact is that wealthy folks are individuals and as such they appear to be paying a lower effective tax rate than millions of people who earn less than they do. This comes after a generation spent giving Americans in the 40-99 percentile of earners more of the federal tax load since 1970, as this chart below shows:

* I basically took the data from three different years and combined them in order to extrapolate figures for recent years that I could not find. Is this shitty analytics? You bet, but it's the best I could do while killing an hour waiting for a phone call. If you can correct the numbers, by all means, do your stuff.


No comments:
Post a Comment